

In distributed cloud environments, understanding what your systems are doing is both essential and challenging. Observability goes beyond traditional monitoring to give teams true insight into system health and performance.
1. The Three Pillars: Metrics, Logs, and Traces
Metrics provide aggregated numerical data over time. Logs capture discrete events with contextual details. Distributed traces follow requests across services, revealing latency bottlenecks and dependency relationships.
2. Building Meaningful Dashboards
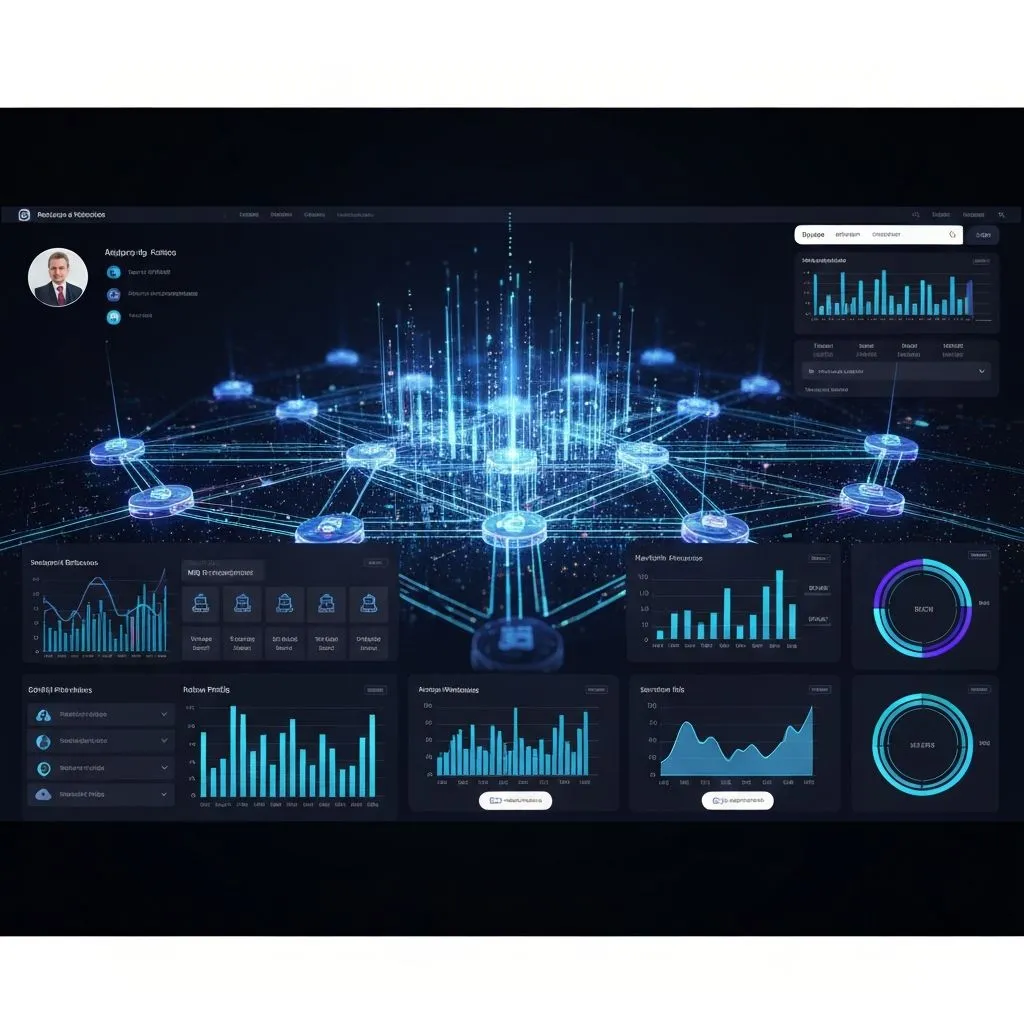
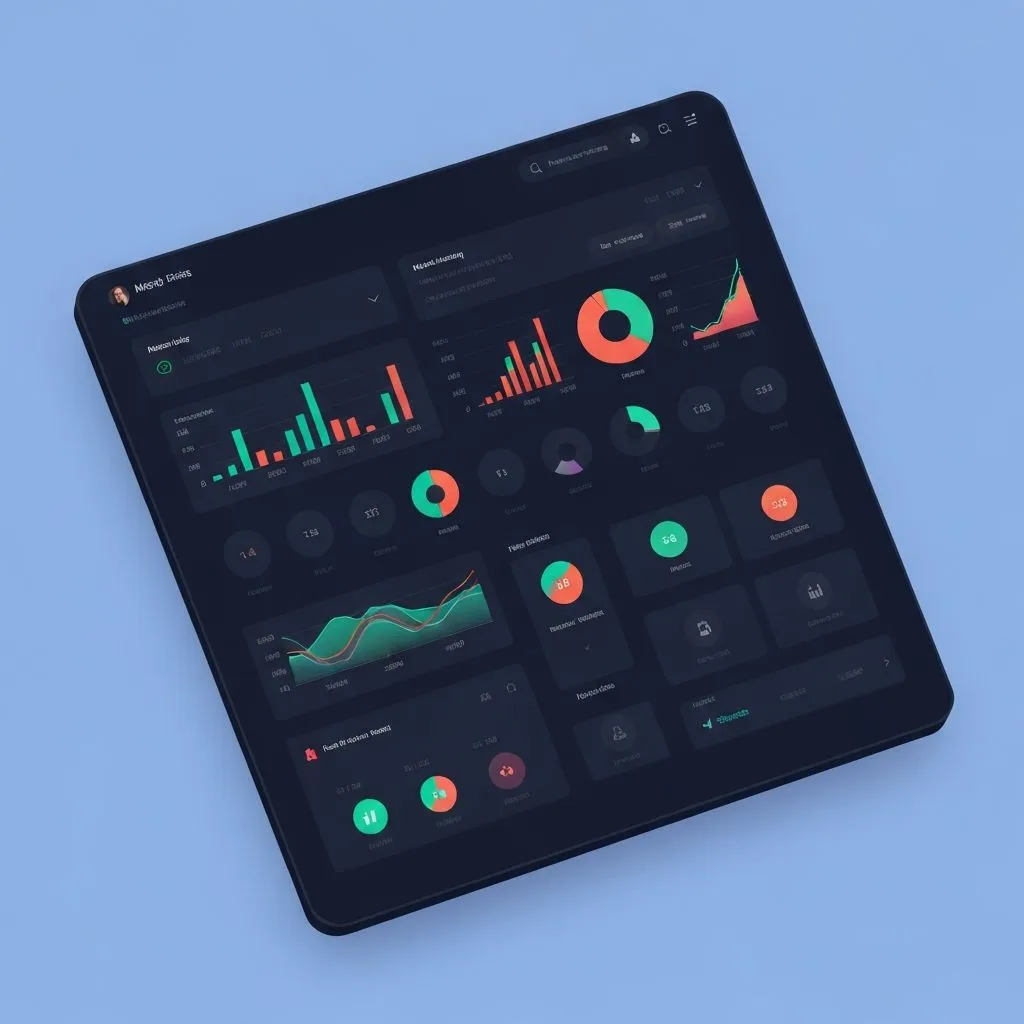
Structure dashboards around the golden signals: latency, traffic, errors, and saturation. Organize by service rather than infrastructure layer. Make anomalies visually obvious.
3. Alerting That Drives Action
Design alerts that are urgent, actionable, and tied to user-facing impact. Use multi-window thresholds to avoid flapping. Maintain runbooks documenting diagnostic steps and remediation procedures.
4. Service Level Objectives and Error Budgets
SLOs formalize reliability targets based on user experience. An error budget quantifies acceptable downtime that teams can spend on calculated risks, balancing innovation with stability.
5. Proactive Monitoring with Synthetic Checks
Simulate critical user journeys from multiple regions. Verify key flows like login, checkout, and search are functional end-to-end, providing early warning before real users are affected.
Conclusion
SKYLINK designs observability solutions giving engineering teams the clarity to run reliable cloud infrastructure at scale, moving from firefighting to continuous improvement.
SkyLink Team
Site Reliability Engineer
SkyLink Team is a seasoned technology professional with extensive experience in devops & infrastructure. At SkyLink, they lead initiatives that drive innovation and deliver exceptional results for our clients.